From Reports > Reports > Cost Price Change History
Below you can see a trailing history for a product called GI ELBOW 1/2″
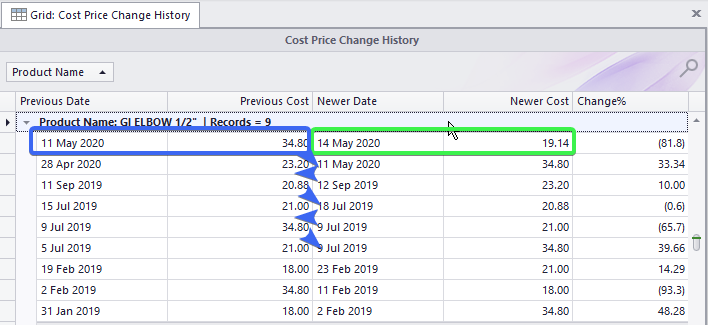
Explanation:
- Report is shown in a ZIZ-ZAG pattern indicated by the arrows
- (Green Box) is the NEWEST date & cost at 19.14
- (Blue Box) On 11/May it was 38.80 (therefore a drop of 81%)
- The first arrow goes to the same date; 11/May, where the price is still 34.80 and prior to that, the price is 23.20 on 28/Apr
- Note that the 3rd row’s “Newer Date” now changes to 12/Sep/19, which means that there was no change in the products cost between 12/Sep/2019 and 28/Apr/2020
From Reports > Transction History > Select the Products tab
Transaction History – Products
Product Performance #
(From Reports > Transction History > Select the Products tab > Search for a product > Click the lightning icon)
Use Product Performance gives you the distribution percentage between your customers, here you can see that 50% of an item is only bought by a single customer, and 92% of this product is bought by the first two customers.
ACTION POINT: Advertise this product to more customers

Product Performance
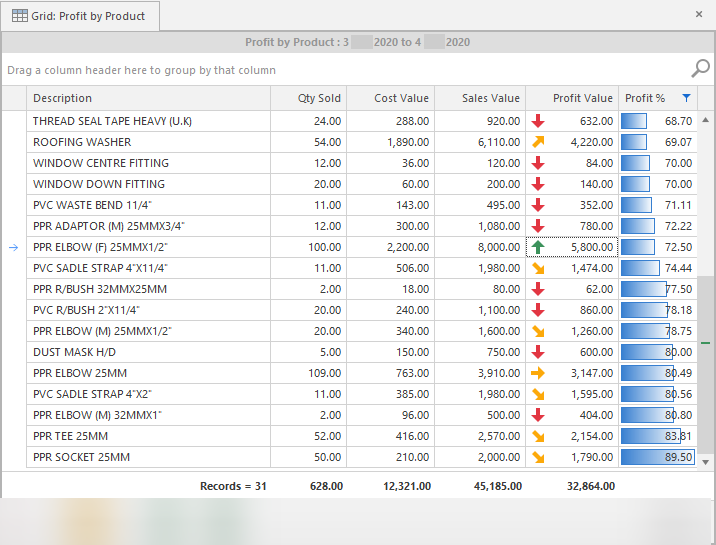
From Reports > Reports > Profit by Product
*Icons, Data Bars, Color Scales can be added by right clicking a column and selecting Conditional Formatting